

Table of Links
2 MindEye2 and 2.1 Shared-Subject Functional Alignment
2.2 Backbone, Diffusion Prior, & Submodules
2.3 Image Captioning and 2.4 Fine-tuning Stable Diffusion XL for unCLIP
3 Results and 3.1 fMRI-to-Image Reconstruction
3.3 Image/Brain Retrieval and 3.4 Brain Correlation
6 Acknowledgements and References
A Appendix
A.2 Additional Dataset Information
A.3 MindEye2 (not pretrained) vs. MindEye1
A.4 Reconstruction Evaluations Across Varying Amounts of Training Data
A.5 Single-Subject Evaluations
A.7 OpenCLIP BigG to CLIP L Conversion
A.9 Reconstruction Evaluations: Additional Information
A.10 Pretraining with Less Subjects
A.11 UMAP Dimensionality Reduction
A.13 Human Preference Experiments
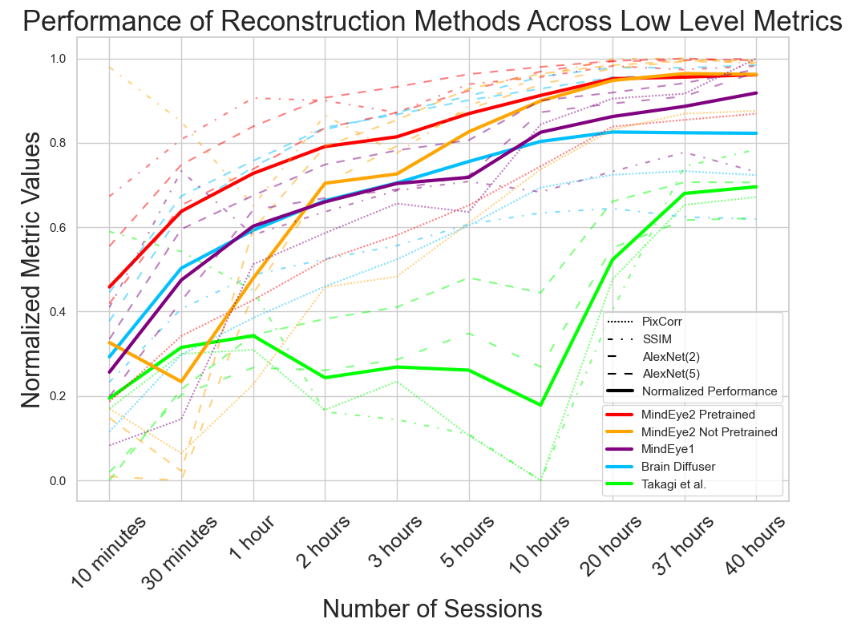
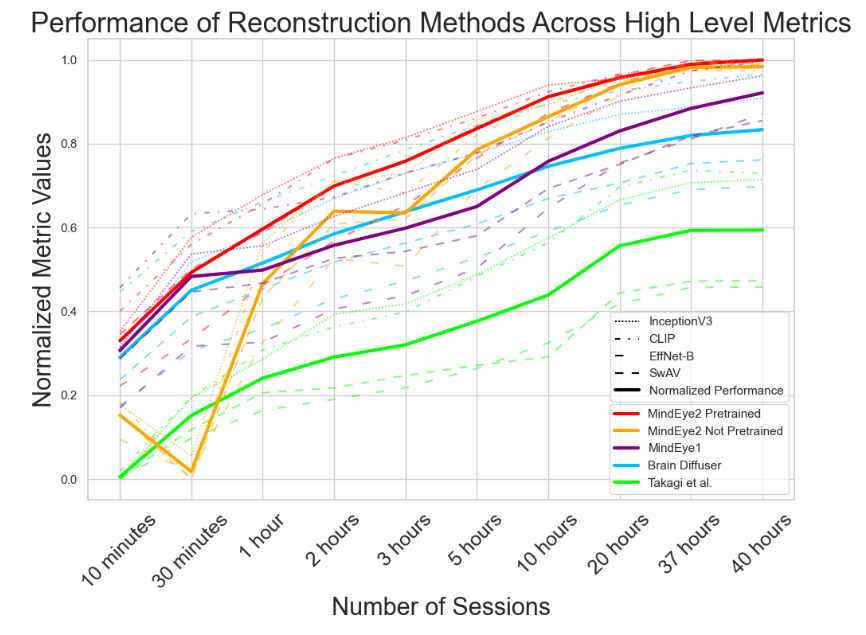
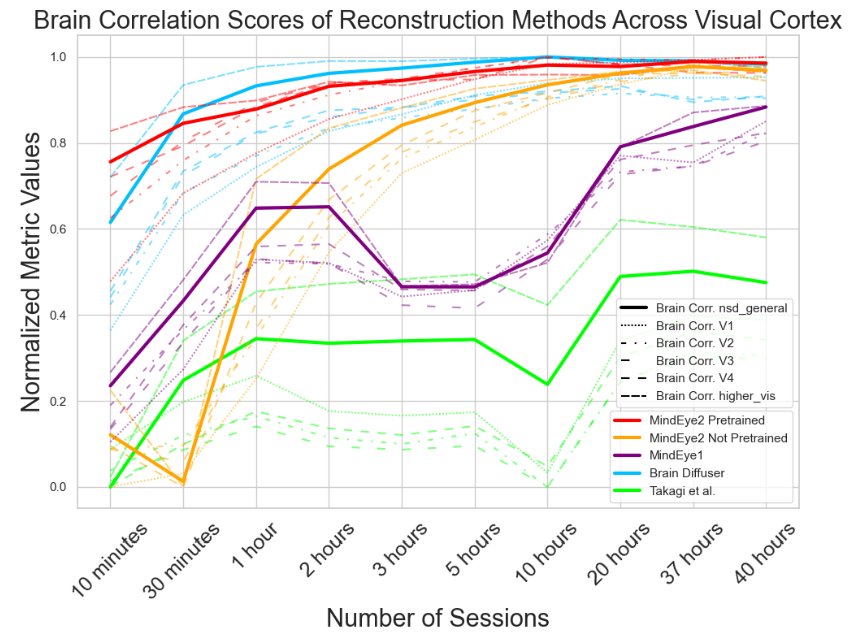
A.4 Reconstruction Evaluations Across Varying Amounts of Training Data
Here, we present a further analysis of how model performance scales with training data. All of the results presented in Figures 6, 7, and 8 are calculated on only subject 1.
This paper is available on arxiv under CC BY 4.0 DEED license.
Authors:
(1) Paul S. Scotti, Stability AI and Medical AI Research Center (MedARC);
(2) Mihir Tripathy, Medical AI Research Center (MedARC) and a Core contribution;
(3) Cesar Kadir Torrico Villanueva, Medical AI Research Center (MedARC) and a Core contribution;
(4) Reese Kneeland, University of Minnesota and a Core contribution;
(5) Tong Chen, The University of Sydney and Medical AI Research Center (MedARC);
(6) Ashutosh Narang, Medical AI Research Center (MedARC);
(7) Charan Santhirasegaran, Medical AI Research Center (MedARC);
(8) Jonathan Xu, University of Waterloo and Medical AI Research Center (MedARC);
(9) Thomas Naselaris, University of Minnesota;
(10) Kenneth A. Norman, Princeton Neuroscience Institute;
(11) Tanishq Mathew Abraham, Stability AI and Medical AI Research Center (MedARC).